第 17.9 节 Telegraf+InfluxDB+Grafana 监控平台
InfluxDB
InfluxDB 是一个用于存储和分析时间序列数据的开源数据库。
InfluxDB 安装与配置
安装
# pkg install influxdb或者
cd /usr/ports/databases/influxdb/ && make install clean加入启动项
# sysrc influxd_enable="YES"启动服务
# service influxd start修改配置
配置文件路径为 /usr/local/etc/influxd.conf
# vim /usr/local/etc/influxd.conf修改完成后重启服务:
# service influxd restart使用
连接数据库
# influx创建数据库
# CREATE DATABASE mydb查看数据库
# SHOW DATABASES创建用户名和密码
# CREATE USER username WITH PASSWORD 'password'Telegraf
安装
# pkg install telegraf加入启动项
# sysrc telegraf_enable="YES"配置
配置文件路径:/usr/local/etc/telegraf.conf
配置 influxdb 连接
我们用的是 influxdb-1.8 的版本,在配置文件中配置如下内容:
# 配置 influxdb 连接内容,此处的内容和上面配置的 InfluxDB 数据库连接账号密码[[outputs.influxdb]] urls = ["http://127.0.0.1:8086"] database = "my_db" username = "username" password = "password"配置采集指标
这里会收集系统 cpu、disk、diskio、memory、swap 等相关指标。下面是 telegraf 配置文件中的部分内容,部分是默认开放,部分需要手动放开注释参数,详情请看官方文档。
# Read metrics about cpu usage[[inputs.cpu]]  ## Whether to report per-cpu stats or not  percpu = true  ## Whether to report total system cpu stats or not  totalcpu = true  ## Comment this line if you want the raw CPU time metrics  fielddrop = ["time_*"]
# Read metrics about disk usage by mount point[[inputs.disk]]  ## By default, telegraf gather stats for all mountpoints.  ## Setting mountpoints will restrict the stats to the specified mountpoints.  # mount_points = ["/"]  ## Ignore some mountpoints by filesystem type. For example (dev)tmpfs (usually  ## present on /run, /var/run, /dev/shm or /dev).  ignore_fs = ["tmpfs", "devtmpfs"]
# Read metrics about disk IO by device[[inputs.diskio]]  ## By default, telegraf will gather stats for all devices including  ## disk partitions.  ## Setting devices will restrict the stats to the specified devices.  # devices = ["sda", "sdb"]  ## Uncomment the following line if you need disk serial numbers.  # skip_serial_number = false
# Get kernel statistics from /proc/stat[[inputs.kernel]]  # no configuration
# Read metrics about memory usage[[inputs.mem]]  # no configuration
# Get the number of processes and group them by status[[inputs.processes]]  # no configuration
# Read metrics about swap memory usage[[inputs.swap]]  # no configuration
# Read metrics about system load & uptime[[inputs.system]]  # no configuration# Read metrics about network interface usage[[inputs.net]]  # collect data only about specific interfaces  # interfaces = ["eth0"]
[[inputs.netstat]]  # no configuration[[inputs.interrupts]]  # no configuration
启动服务
# service telegraf startGrafana
安装
查找 Grafana
pkg search grafana返回结果如下:
grafana-loki-2.8.1 Scalable, highly-available, multi-tenant log aggregation systemgrafana8-8.5.27 Dashboard and graph editor for multiple data storesgrafana9-9.5.5 Dashboard and graph editor for multiple data storespy39-grafana-dashboard-manager-0.1.3 CLI for saving and restoring Grafana dashboards via HTTP APIrubygem-aws-sdk-managedgrafana-1.15.0 Official AWS Ruby gem for Amazon Managed Grafana安装
从上面的查询可以看到,有多个版本的 Grafana,这里我们选择 grafana9-9.5.5 这个版本。
# pkg install grafana9-9.5.5设置系统启动
# sysrc grafana_enable="YES"启动
启动服务
# service grafana start使用
登录
默认的登录地址为:http://localhost:3000,默认登录账号密码如下:
admin # 账号admin # 密码登录后会要求修改密码,请务必使用强密码!
配置数据源
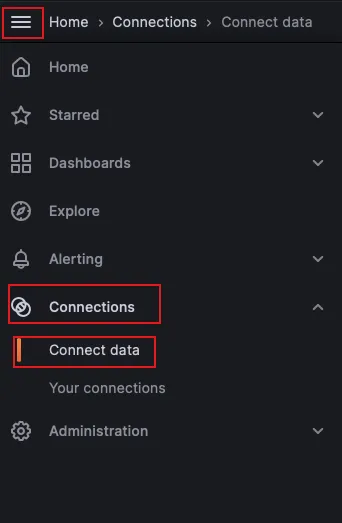
-
登录后点击左上角的 Toggle Menu -> 选择 Connections -> 选择 Connect data
-
在右边的输入框中输入
InfluxDB-> 选择搜索出来的 InfluxDB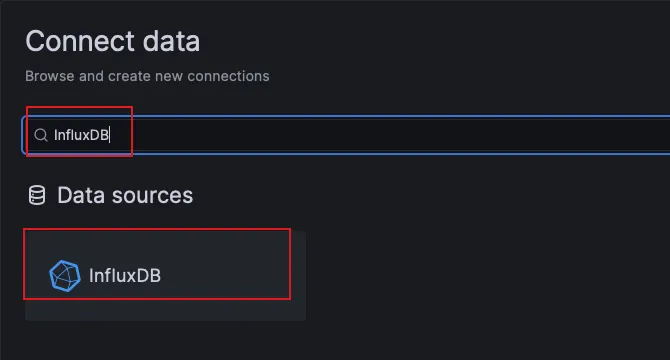
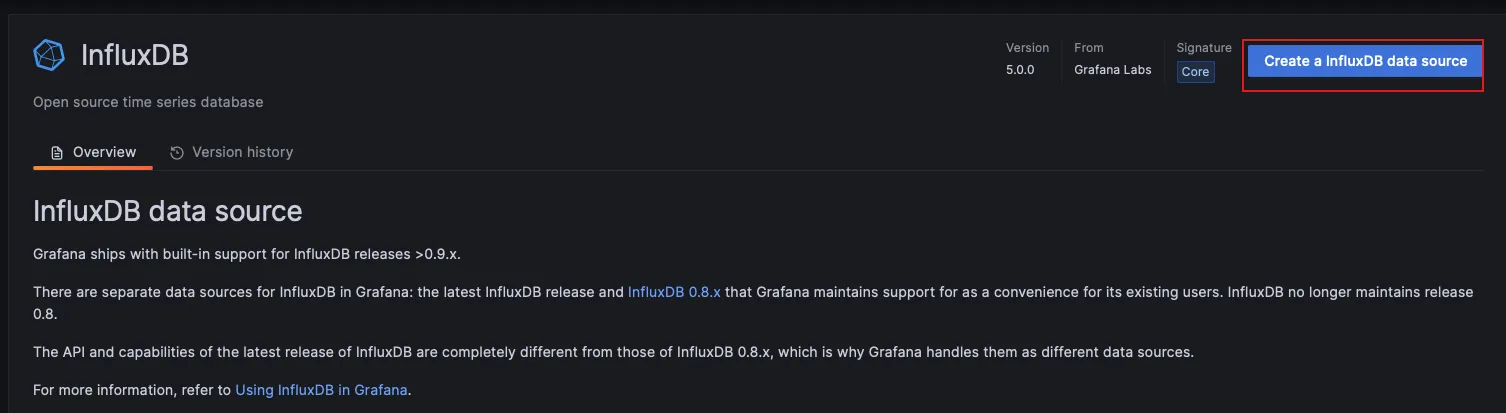
-
点击右上角的 Create a InfluxDB data source 按钮 -> 配置 InfluxDB 相关的内容。
-
在数据源配置页面填写相关的 InfluxDB 连接信息,需配置内容如下:
注意:我们上面使用的是 influxdb1.8,所以选择的查询语言一定要选 InfluxQL
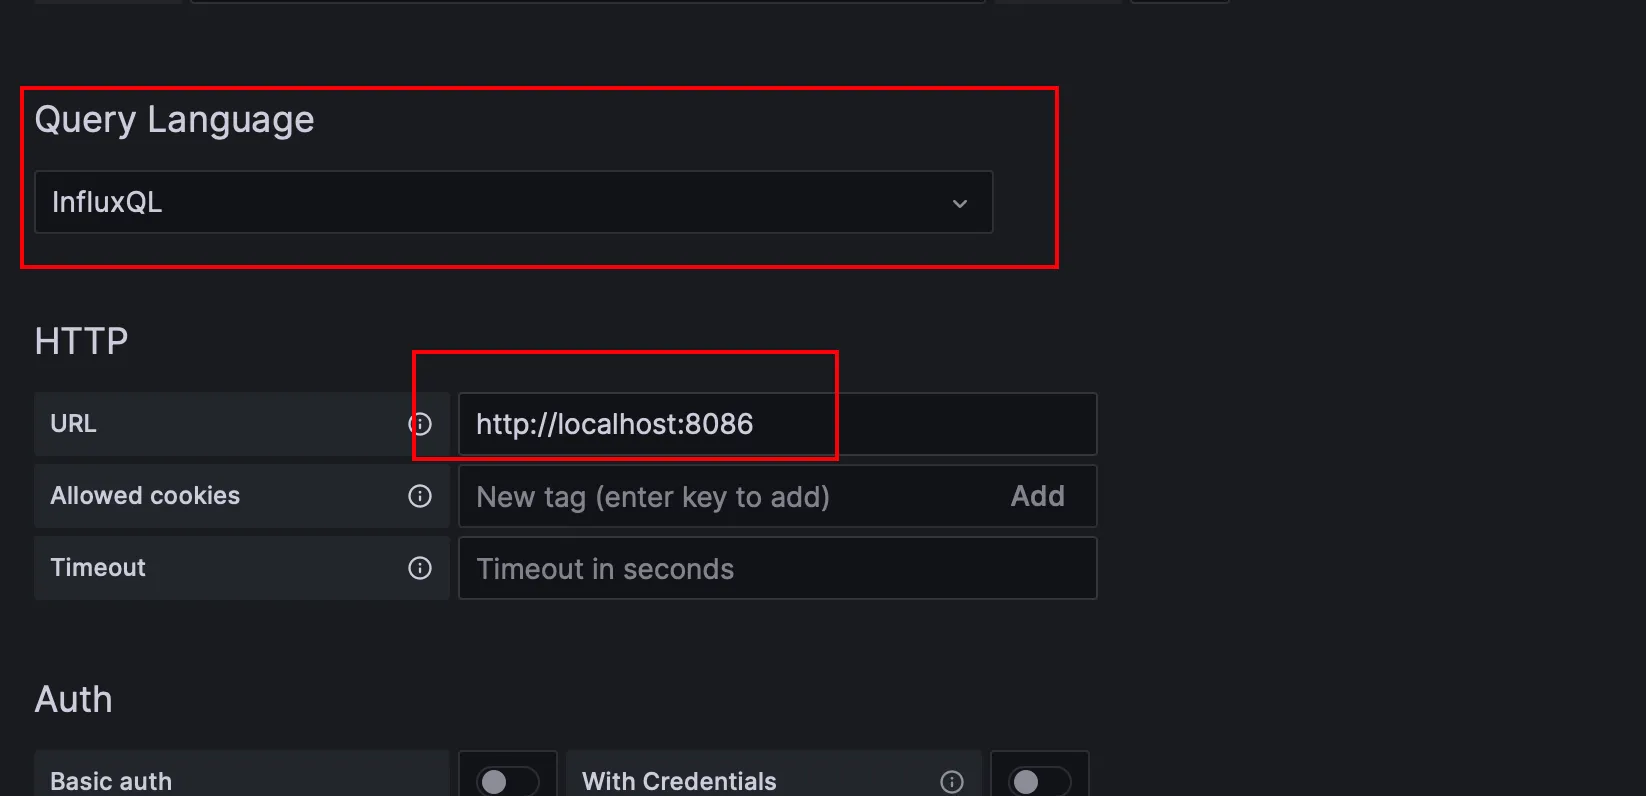
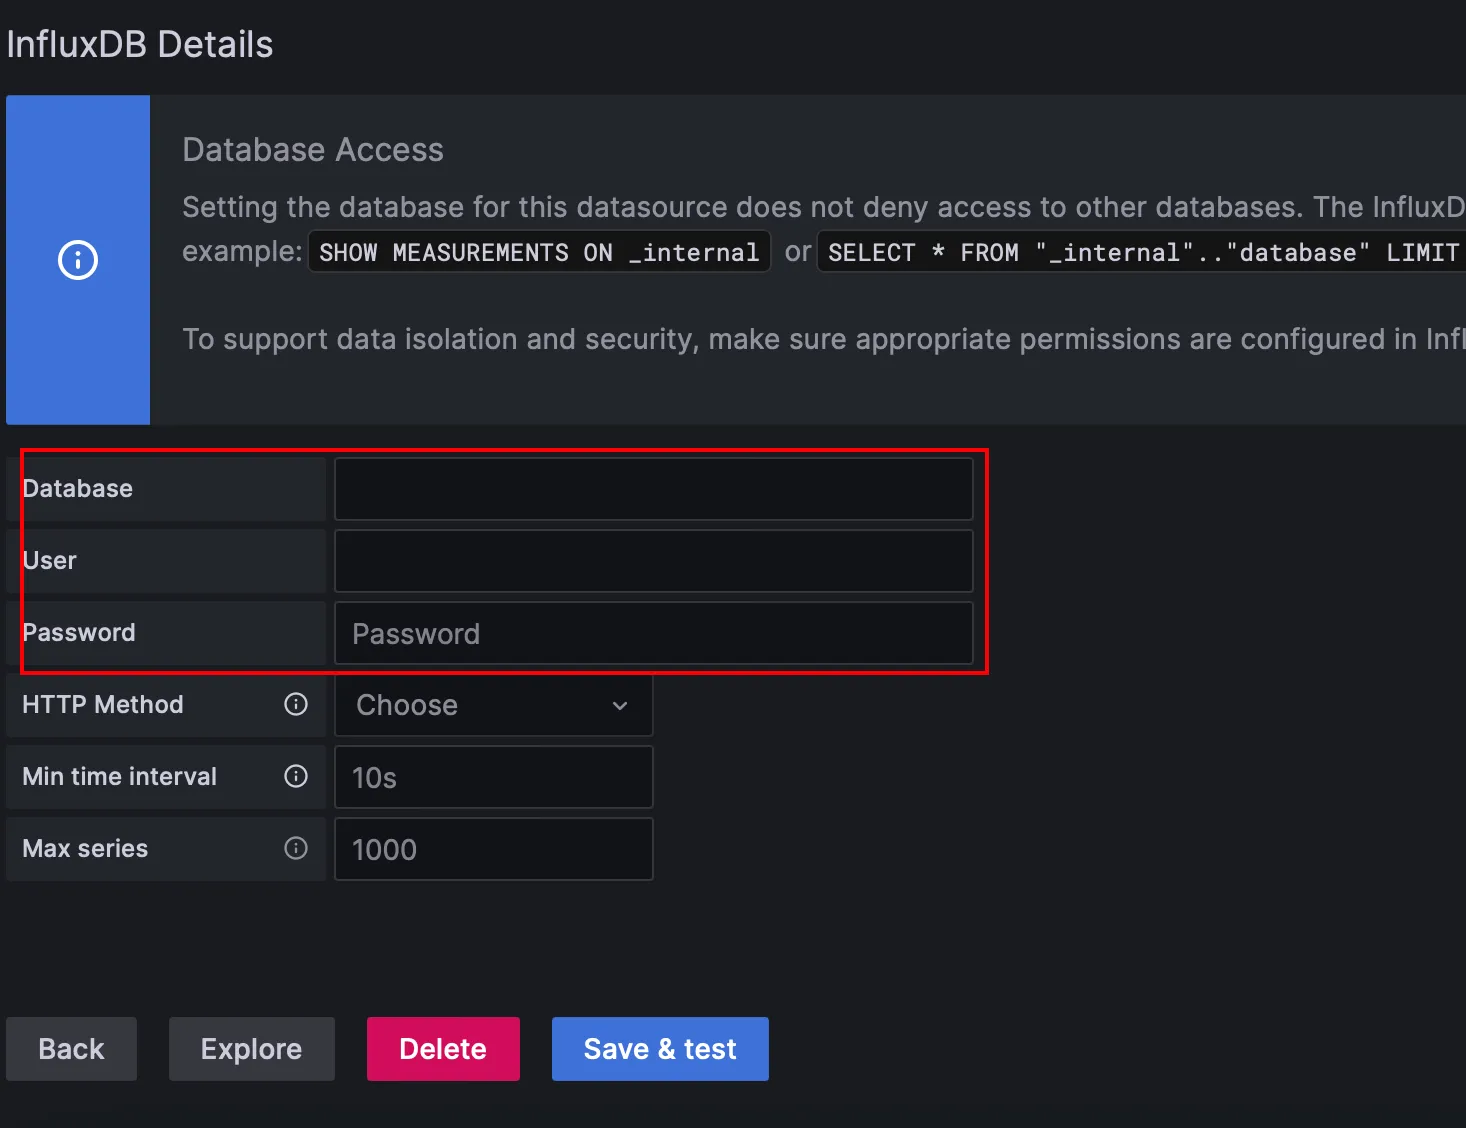
点击
Save & Test按钮保存配置。
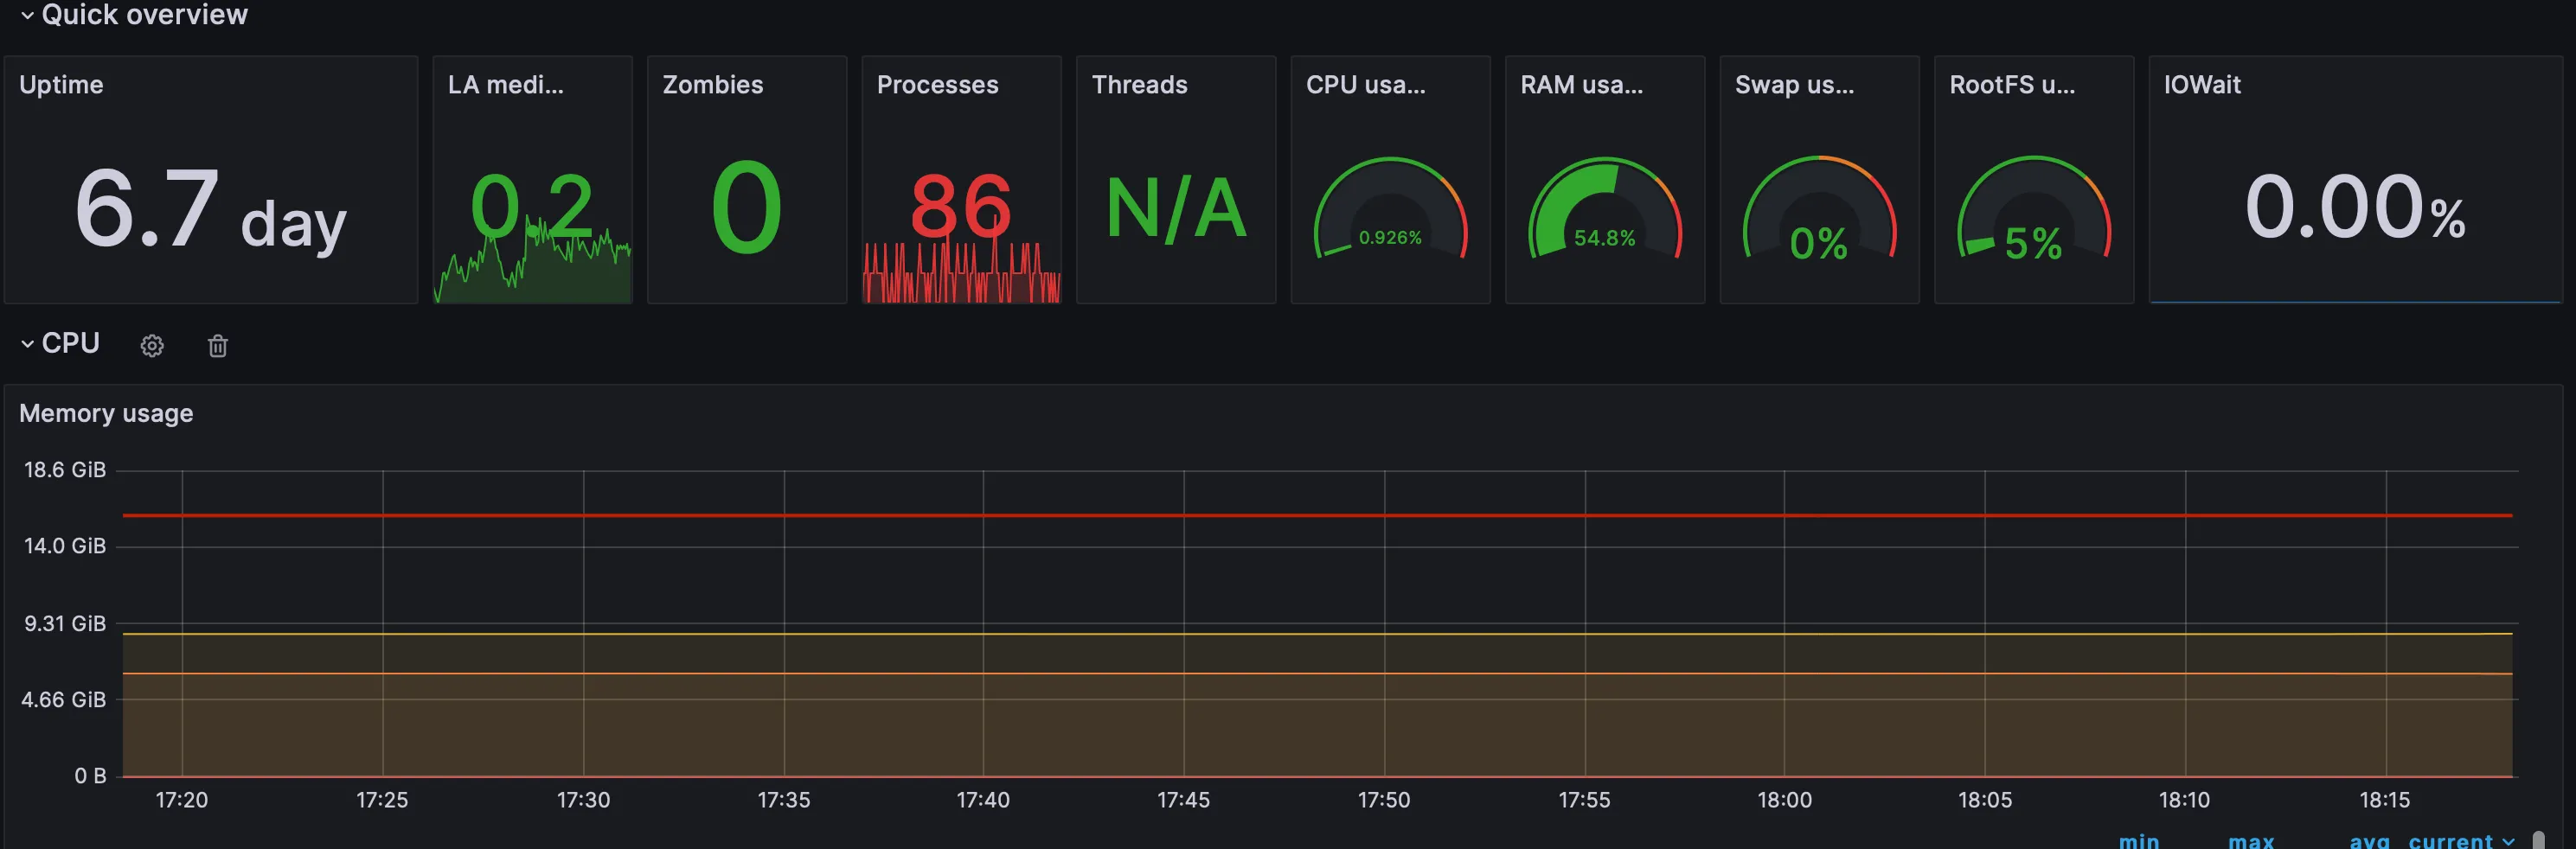
配置 Dashboard
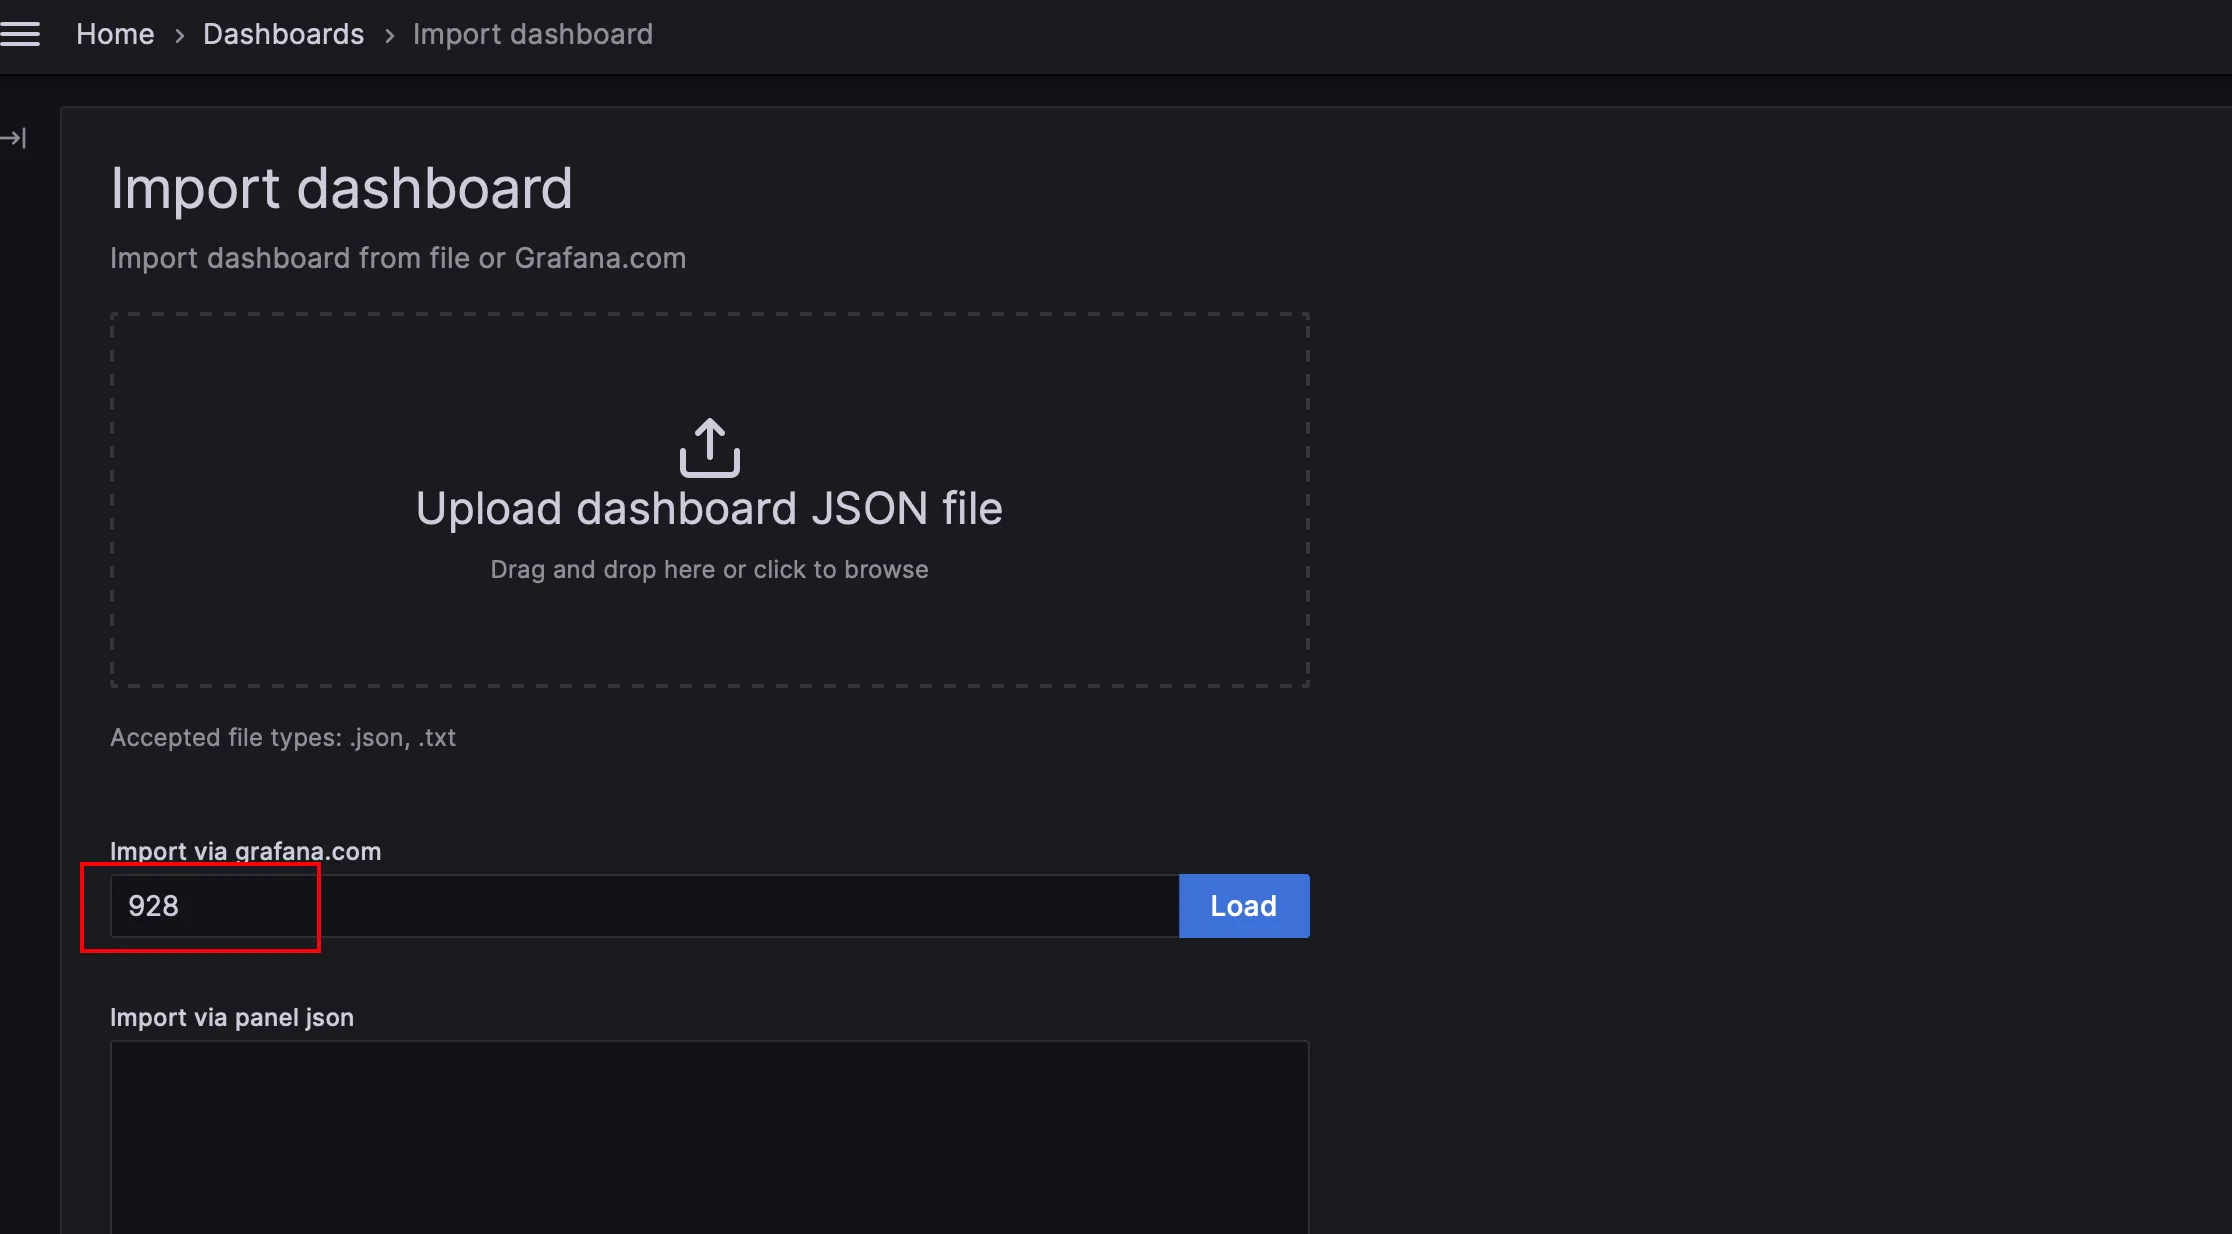
选择展示数据的 dashboard,可以自行开发,也可以官方模版库中其他人开发好的模版。这里导入一个 id 为 928 的模版。
-
导入模版,点击右上角的
+->Import dashboard进入导入模版页面。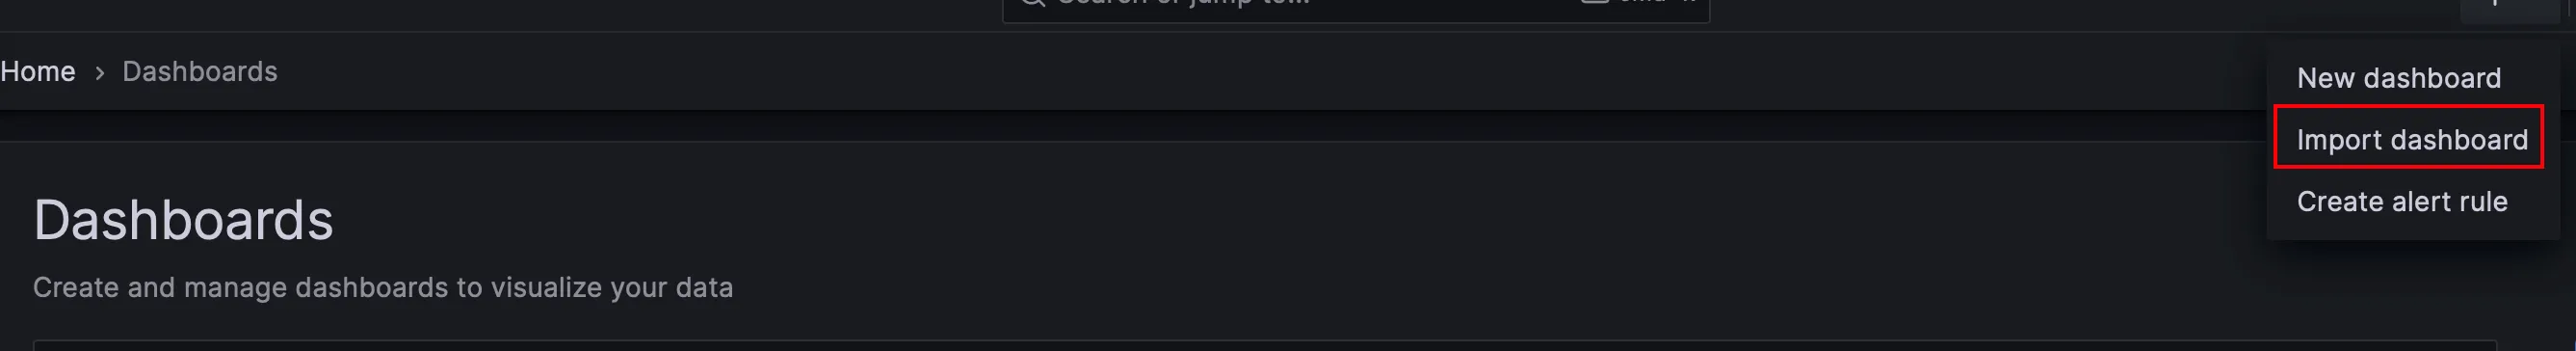
-
选择 id 为 928 的模版导入
-
模版最终效果